Friday, 27 May 2016

Creating First JMeter Script


In our previous and third post of JMeter, we have discussed about two main component required for creating a JMeter script. Follow the previous post first, if you are new to JMeter and have not seen that post.

So now I can hope that you have setup the JMeter on your machine to start with this session.

There are two default components you will see, when you will start the JMeter:

  1. Test Plan, and
  2. WorkBench

Test Plan describes the series of steps JMeter will execute when run whereas Work Bench is a temporary space provided to store test elements not in use, for copy/paste option or any other purposes you desire. While saving the test plan, workbench elements are not saved with it until you select the ‘Save Workbench’ option.

To start with creating your first JMeter script, follow the following steps:

  1. Add a ‘Thread Group’ to the ‘Test Plan’
  2. Now add ‘HTTP(S) Test Script Recorder’ to the ‘WorkBench’
  3. Set the browser and ‘HTTP(S) Test Script Recorder’ to one free port
  4. Also select the ‘Target Controller’ before starting the ‘HTTP(S) Test Script Recorder’
  5. Now perform the user actions and all the requests will be recorded under the selected target controller

See the following screenshot for better understanding:


You can see that I have selected ‘CrazzyGig Thread Group’ in the ‘Target Controller’, so all the recorded requests will be saved under the ‘CrazzyGig Thread Group’. 

This is just the simple recording of the steps performed by the user, In next we see the script recording in more detail that way we can reuse the same scripts without any modification in scripts.

Please like and comment if you liked the post.  Stay tuned to see more posts.


Thursday, 12 May 2016

Thread Group and HTTP(S) Test Script Recorder

In the next post we will see how to create JMeter Script, but I thought; it would be good to explain the ‘Thread Group’ and ‘HTTP(S) Test Script Recorder’ first. In order to create a script; you will need to add these two components. So, let’s begin with it.

Thread Group

Open JMeter, you will see the following screen:


Now, right click on ‘Test Plan’ and add a Thread Group.  Follow the flow to add the same: “Add >> Threads (Users) >> Thread Group”


Following are the components of the Thread Group:


  • Name: Name of the thread group, which user can set as desired.
  • Comments: Comments related to the thread group. Comments can help any new user to understand the work designed to perform by thread group.
  • Action to be taken after a sampler error: Option given under section will execute based on the user selection, in case any sampler error occurs.
          Continue - ignore the error and continue with the test
          Start Next Loop - ignore the error, start next loop and continue with the test
          Stop Thread - current thread exits
          Stop Test - the entire test is stopped at the end of any current samples.
          Stop Test Now - the entire test is stopped abruptly. Any current samplers are interrupted if                   possible.
  • Number of Threads (users): This parameter defines the number of virtual users you want to test on the application.
  • Ramp-up period (in seconds): This parameter defines the duration in which the user will be ramped up until the total numbers of VUs are up and running.
  • Loop Count: This parameter defines the number of iteration you need to run. There is a ‘Forever’ checkbox which can be ticked to run it infinitely.
  • Delay Thread creation until needed: If selected, threads are created only when the appropriate proportion of the ramp-up time has elapsed.
  • Scheduler: This parameter is used to enable the scheduler. It provide the start time, end time, total duration for which test should run and startup delay; which can be used to delay the startup defined in start time parameter.


HTTP(S) Test Script Recorder

HTTP(S) Test Script Recorder allows JMeter to intercept and record all your actions while you browse your web application on your browser. JMeter creates test sample objects and store them directly into selected target controller.

To add the HTTP(S) Test Script Recorder follow the steps mentioned below:

Add the http(s) recorder into workbench. Do right click on workbench and add ‘HTTP(S) Test Script Recorder’. Follow the flow, Add >> Not-Test Element >> HTTP(S) Test Script Recorder


After adding the HTTP(S) recorder:


There are few important attributes of HTTP(S) recorder, which a user should know about before creating the performance script. Following are the mandatory attributes which will be required to set before recording:

Under ‘Global Settings’ one can see the ‘port’ attribute. Actually recorder is implemented as HTTP(S) proxy server. You need to set up your browser and tool on the same port. 8080 is the default port, you can change it.

Under ‘Test plan content’, there is an attribute called ‘Target Controller’. It defines the controller where the recorder will place the generated samples.

Now we are good to start recording, leave other attributes as it is. To start the recording, start the recorder by clicking the start button at the bottom.

You will see a certificate prompt like:


Click ok and start recording.

Stay tuned to see more updates on JMeter.


Thursday, 3 December 2015

Configuring JMeter

As we already discussed in previous and first post of JMeter is that JMeter is 100% pure Java application, hence it is required to have installed JVM on your system.

Following are the minimum requirement before you try to run JMeter :

Java Environment
  • Minimum Java Version 1.6 or higher is best. Follow the instructions on Oracle's official website to see how to set the JAVA_HOME environmental variable.
Operating System
  • Any operating system which has Java compliant implementation should be able to run JMeter without any problem.
Running JMeter
  • Once the JVM is set and running, download the JMeter release or nightly build and unzip in local drive.
  • If you are running JMeter on Windows. Go to JMeter's unzipped directory and navigate to bin directory and run jmeter.bat file.
  • If you are running JMeter on Linux/Unix system. Go to JMeter's unzipped directory and navigate to bin directory and run jmeter.sh file using terminal.
  • If you are running JMeter on Mac. Go to JMeter's unzipped directory and navigate to bin directory and run jmeter.sh file using terminal.
 JMeter UI
This is the view of JMeter you will see after launching it:


Stay tuned to see more updates on JMeter.

Facebook Page : https://www.facebook.com/crazzzygig 

References : http://jmeter.apache.org/

Saturday, 28 November 2015

Introduction To JMeter

JMeter is an open source software by Apache Software Foundation, a 100% pure Java application designed to measure performance. Initially it was designed to test Web Application but later expanded to test other test functions.

The protocols supported by JMeter are:
  • Web – HTTP, HTTPS.
  • SOAP / REST
  • FTP
  • Database via JDBC
  • LDAP
  • Message-oriented middleware (MOM) via JMS
  • Mail – SMTP(S), POP3(S) and IMAP(S)
  • MongoDB (NoSQL)
  • Native Command or Shell Scripts
  • TCP

Following are the features of JMeter:
  • As it is open source software, it is available for free.
  • JMeter is a platform-independent software. On Windows it can be invoked by starting the jmeter.bat file and on Linux it cab be invoked by clicking the JMeter shell script.
  • JMeter stores its test plans in XML format.
  • JMeter is a multi-threading framework allows concurrent sampling by many threads and simultaneous sampling of different functions by separate threads group(Users).
  • JMeter can also be used to test automated and functional testing of the application.

Following are the terms you will encounter frequently while using JMeter:
  • Test Plan – A test plan describes a series of steps JMeter will execute when run. A test plan can consist of one or more Thread Groups, Controllers, Samplers, Listeners, Timers, Assertions and Configuration elements.
  • Thread Group – Thread Groups is a collection of groups.Basically each thread represents one user running against the Application Under Test(AUT). It is the starting point under the test plan.
  • Samplers – Samplers are the way to send all types of requests to server supported by JMeter.
  • Controllers – Controllers allows you to control when to send a user request to a server. There are various type of controllers such as logic controller etc., we will discuss those in detail in later posts.
  • Listeners – Listeners are nothing but way to show the results of samplers in form of tables, graphs, trees or in simple text format.
  • Timers – While sending requests JMeter thread sends request without any pause between each sampler. Timers allows you to define a period to wait between each request.
  • Assertions – As it is self defined word provides the capability to include some validation on the response of the request sent. By using different assertions we can assure that sent request is returning correct or expected data.
  • Configuration Elements – There are various configuration elements in JMeter, it works very closely with samplers and can only be accessed inside the three branch where it is placed. It allows to create defaults and variables to be used by samplers.
Stay tuned to see more updates on JMeter.


References: http://jmeter.apache.org/

Sunday, 16 August 2015

TestNG-XSLT Report Using Maven


An effective communication is the key to success. The knowledge and skills you acquire are of no use to others if it is not conveyed well. You will have to be able to gather information, organize it, and present it in a logical and concise form to convey the exact meaning you intend.

In the same way Reporting is the most important and critical part of any automated test execution, as it helps users and stakeholders to understand the exact result of the execution, reasons for the failures and also helps to determine the next steps.

As we have already seen TestNG default report in previous post (TestNg Link), so in this post we will focus on how to make reporting more presentable using XSLT. XSLT or Extensible Stylesheet Language Transformations is a language for transforming XML documents into other XML or other formats. It is intended to perform complex styling operations, like generation of tables of contents and indexes.

In this post we will see how to implement XSLT report using TestNG and Maven. Following are the tools being used for this post:

Maven: A Build Management Tool

TestNG: A Test Automation Framework

Selenium WebDriver: A Web Test Automation Tool

Setup all these tools in choice of your IDE; in this post we are using Eclipse IDE. Now, create a maven project and open the auto-generated pom.xml. Edit your pom.xml as written below:

<project xmlns="http://maven.apache.org/POM/4.0.0"
         xmlns:xsi="http://www.w3.org/2001/XMLSchema-instance"
         xsi:schemaLocation="http://maven.apache.org/POM/4.0.0
         http://maven.apache.org/xsd/maven-4.0.0.xsd">
       
       <modelVersion>4.0.0</modelVersion>

       <groupId>com.blogger</groupId>
       <artifactId>xsltreport</artifactId>
       <version>0.0.1-SNAPSHOT</version>
       <packaging>jar</packaging>

       <name>xsltreport</name>
       <url>http://maven.apache.org</url>

       <properties>
              <project.build.sourceEncoding>UTF-8</project.build.sourceEncoding>
       </properties>

       <dependencies>
              <dependency>
                     <groupId>org.seleniumhq.selenium</groupId>
                     <artifactId>selenium-java</artifactId>
                     <version>2.45.0</version>
              </dependency>


              <dependency>
                     <groupId>org.testng</groupId>
                     <artifactId>testng</artifactId>
                     <version>6.8.21</version>
              </dependency>

       </dependencies>

       <build>
              <sourceDirectory>src/test/java</sourceDirectory>
              <plugins>
                     <plugin>
                           <groupId>org.apache.maven.plugins</groupId>
                           <artifactId>maven-surefire-plugin</artifactId>
                           <version>2.14.1</version>
                           <configuration>
                                  <testFailureIgnore>true</testFailureIgnore>
                                  <skipTests>false</skipTests>
                                  <suiteXmlFiles>
                                         <suiteXmlFile>testng.xml</suiteXmlFile>
                                  </suiteXmlFiles>
                           </configuration>
                     </plugin>
                     <plugin>
                           <artifactId>maven-compiler-plugin</artifactId>
                           <configuration>
                                  <encoding>iso-8859-1</encoding>
                                  <source>1.6</source>
                                  <target>1.6</target>
                           </configuration>
                     </plugin>
              </plugins>
       </build>

       <reporting>
              <plugins>
                     <!-- TestNG-xslt related configuration. -->
                     <plugin>
                           <groupId>org.reportyng</groupId>
                           <artifactId>reporty-ng</artifactId>
                           <version>1.2</version>
                           <configuration>
                                  <!-- Output directory for the testng xslt report -->
                                  <outputDir>/target/testng-xslt-report</outputDir>
                                  <sortTestCaseLinks>true</sortTestCaseLinks>
                                                        <testDetailsFilter>FAIL,SKIP,PASS,CONF,BY_CLASS</testDetailsFilter>
                                  <showRuntimeTotals>true</showRuntimeTotals>
                           </configuration>
                     </plugin>
              </plugins>
       </reporting>

       <pluginRepositories>
              <pluginRepository>
                     <id>reporty-ng</id>
                     <url>https://github.com/cosminaru/reporty-      ng/raw/master/dist/maven</url>
              </pluginRepository>
       </pluginRepositories>

</project>

In the above pom.xml we have added following components:

Selenium and TestNG Maven dependencies

build block containing Surefire plugin and maven-compiler plugin.

reporting block containing configuration of Testng-XSLT report.

pluginrepository block containing location of the reporty-ng.

Now we are done with the pom.xml configurations and it’s time to move further. Following the structure of the project created for this post:


As you can see we have two test classes along with three more xml files except pom.xml. In which testng.xml is being used to define the suite files and suiteA.xml and suiteB.xml are separate files for each test classes. We have separated these two test classes in different xml files just to show how the report will look like when we have multiple test suites.

suiteA.xml


suiteB.xml


testng.xml


Now we are ready to execute to the test and generate TestNG-XSLT report. To execute the test we will use maven command.

Navigate to workspace directory where pom.xml is present and run the following command:

mvn clean test -fae site org.reportyng:reporty-ng:1.2:reporting

After successful completion of the execution you will see BUILD SUCCESS information on command prompt.


Now go through the reporting block of pom.xml and see the mentioned path for XSLT report. In our case it is: <outputDir>/target/testng-xslt-report</outputDir>


Navigate to the mentioned directory and you will see the index.html file.
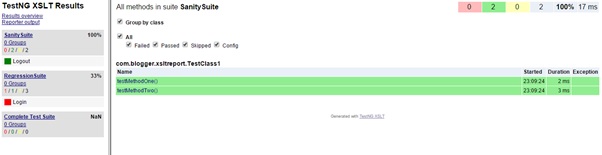
Index.html


In this view you can see complete summary of passed, failed and skipped tests. The pie chart shows the percentage of all passed, failed and skipped tests. With this view a user can easily understand the status of the build and can decide the further steps to take.

For detailed status of the different suites, click on each of the link from the sidebar.

In sanity suite all the test cases have been passed.


In Regression suite one test failed, one passed and one skipped.


Please like and comment if you liked the post.  Stay tuned to see more posts.